This crochet piece started it all, but it was not planned as part of my capstone project. In fact, it started out as just a proof of concept for a class assignment in graduate school.
For my Digital Humanities class, we were tasked with creating a digital humanities project proposal (shocker I know). After my professor encouraged me to incorporate crochet as a unique multimodal aspect, the first iteration of Stats to Stitches was born.
At its inception, the idea was to create a website that would make a crochet pattern from uploaded data and offer step-by-step instructions on how to make a data-driven crochet project. While the resources portion of the project has remained, other aspects of this iteration of Stats to Stitches were not feasible for me as I can’t code and have never written crochet patterns.
Still, I liked the idea of combining my love of crochet and passion for voting rights and decided to actually make a data-driven crochet piece. Thus, the voter turnout blanket was born.
But how was the blanket actually created?
Finding the Data
The first step was deciding what data to use. I knew I wanted the piece to focus on voting and elections in the United States but was not sure of what piece of that puzzle to incorporate.
After some intense googling, I decided to focus on voter turnout in general rather than a specific topic or subgroup of voters in the hopes of providing a good overview of voting in the United States. While many organizations and projects provide this information, like the US Census Bureau, I chose to use data from the United States Elections Project for several reasons: its dataset went back to the first election in 1789 and the data represented the voting-eligible population rather than the voting-age population, making it more exact (learn about the difference here).
The US Elections Project also provided the data in sharable spreadsheets with the year and percentage of voter turnout, making it easy to play around with.
Working with the Data
Armed with my data, I now had a few decisions to make. First, what type of crochet piece did I want to create? I considered making a scarf as it would have been wearable, but ultimately went with a blanket as I had never made anything of that scale before.
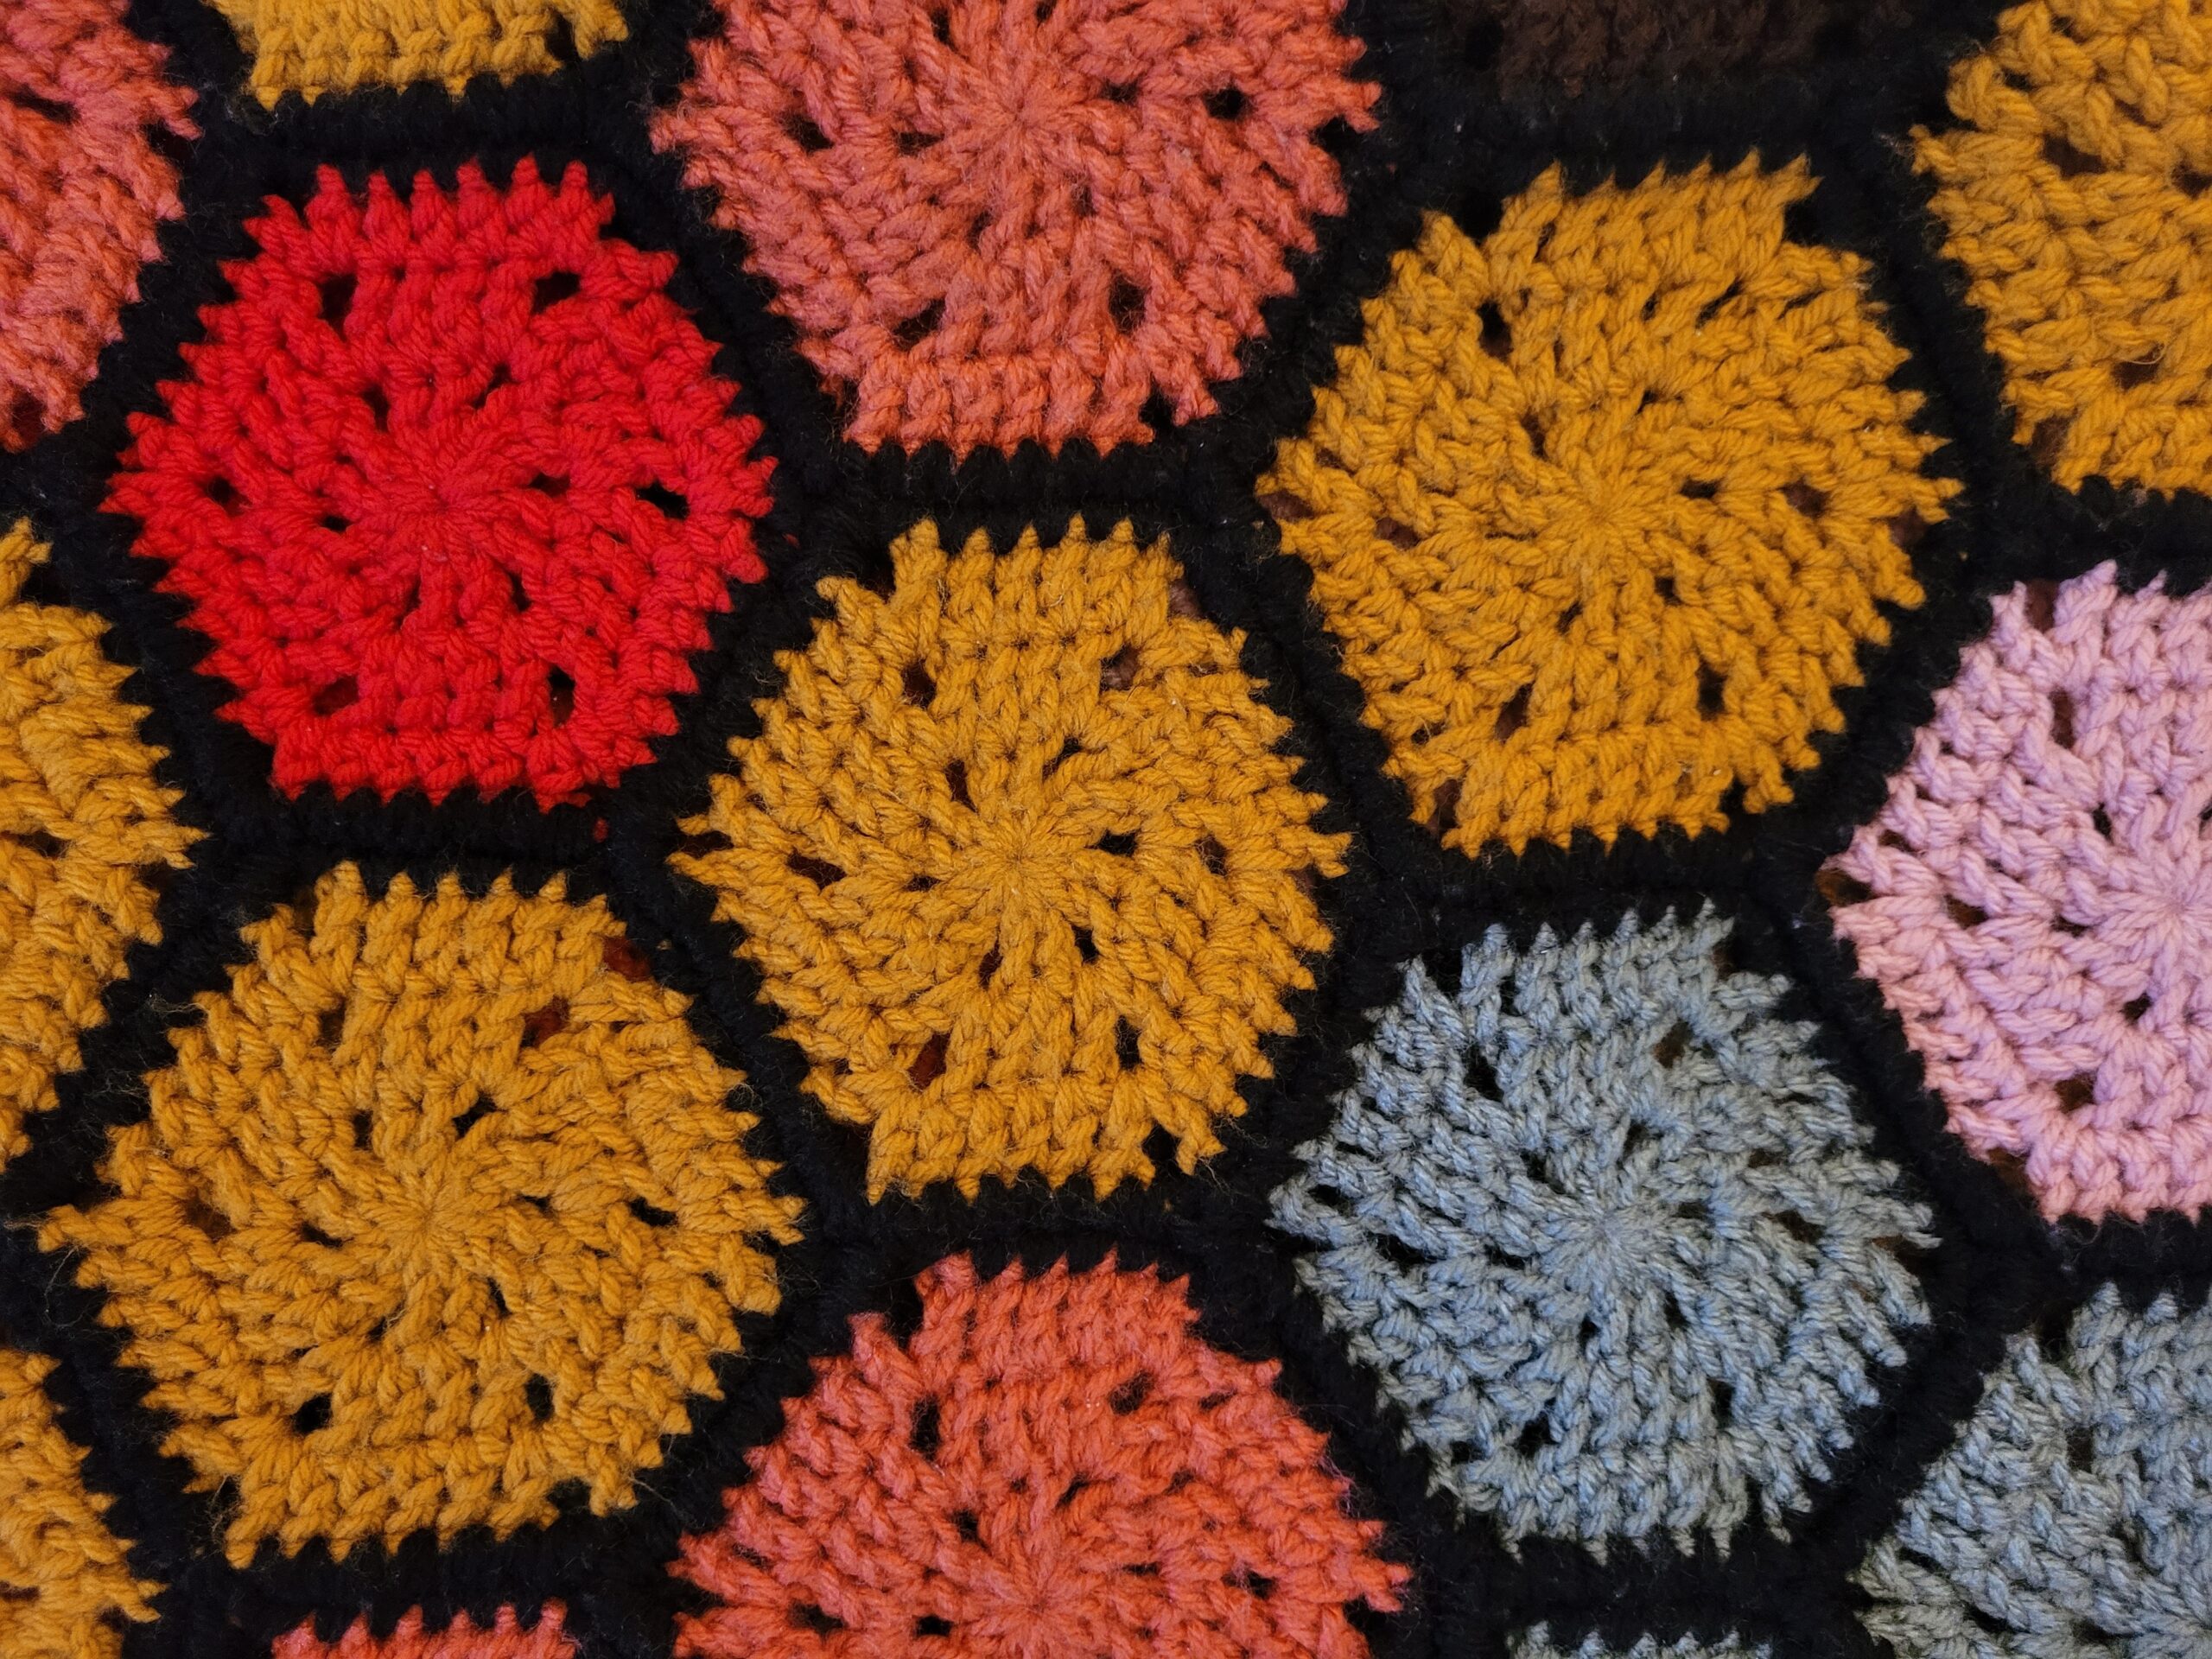
Second, how did I want to represent the data? There were a couple different options, like making a pie chart or bar graph. Based on the type of data-driven crochet projects I’d seen — namely temperature blankets — I went with a color scales approach. I also decided to have the blanket consist of hexagons, with each hexagon representing a Federal election in the United States.
Color scales allow one to visualize information by assigning a range of data a color. In my case, with voter turnout percentages ranging from 6.3% to 82.6%, I went with a 10% range of voter turnout per color. This resulted in nine colors throughout the blanket, so I chose individual colors for each range rather than a color scale to make the ranges more distinct.
Looking back, I wish I chose more cohesive coloring, but at the time I did not know my whole capstone project would later revolve around what this blanket started.
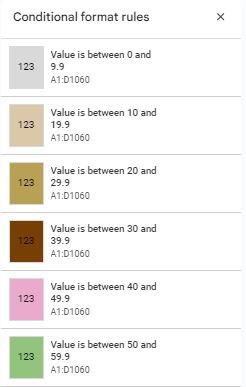
With formatting decided, I then added the conditional format rules into my google sheet by selecting the rule “is between” and inputting my ranges and their corresponding colors (visit Google’s help center for more details on conditional formatting).
Now that my data was organized and color coded, I made a chart of how the blanket would look overall to use as a reference when stitching everything together.
Crocheting the Blanket
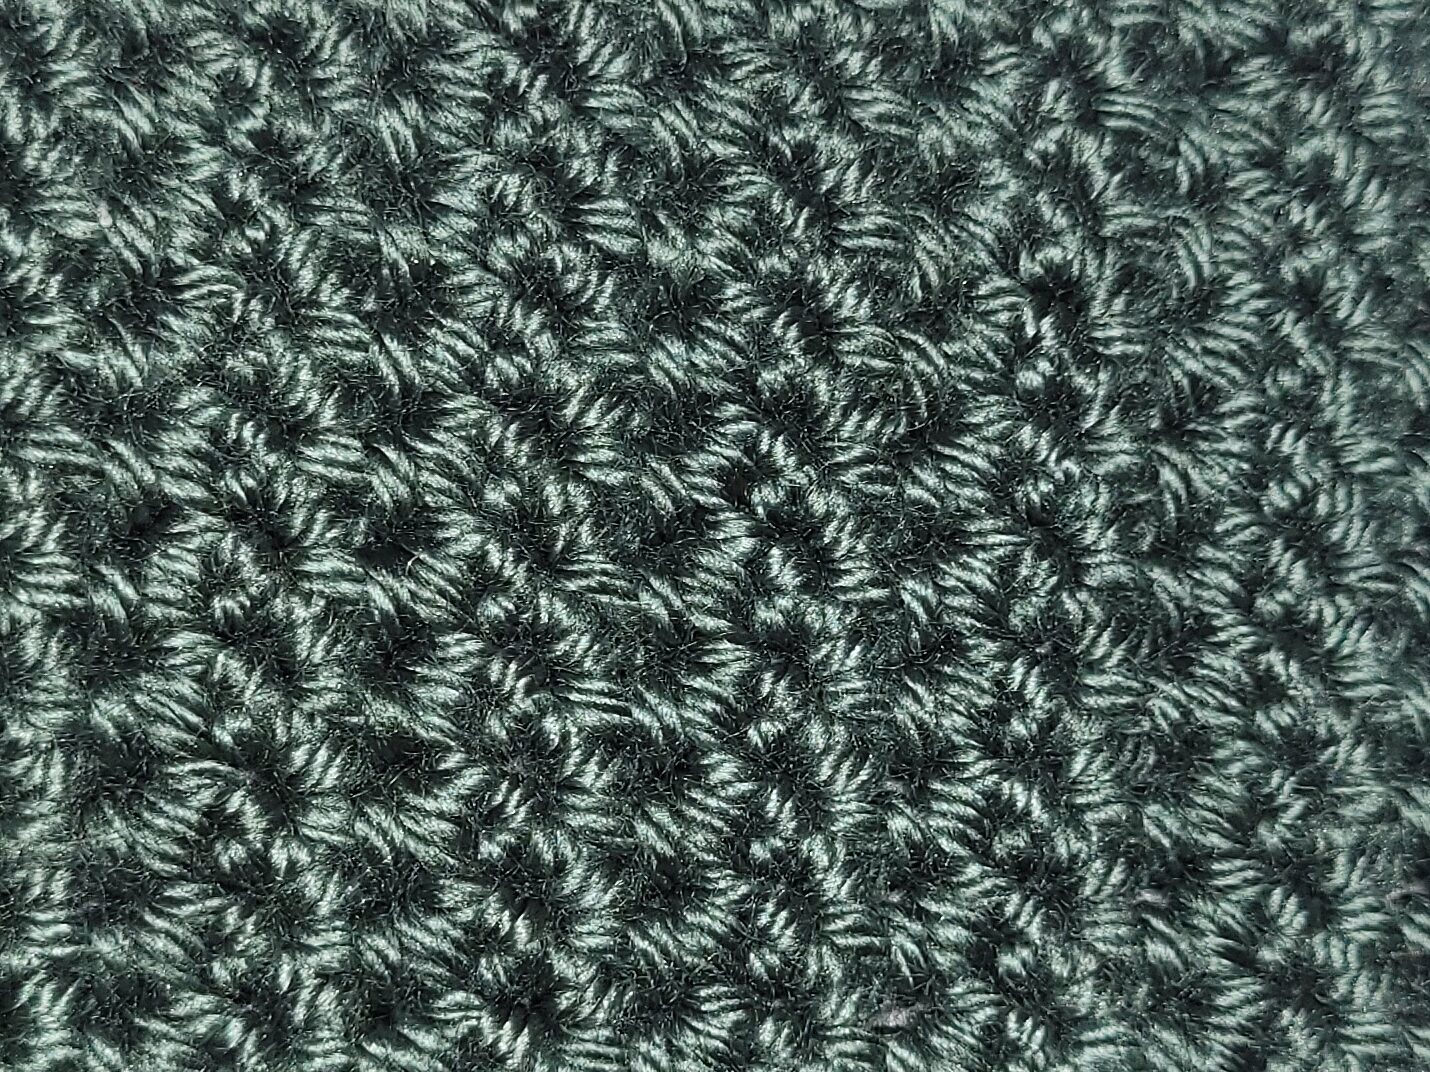
After finding a hexagon pattern I liked, purchasing my yarn, and ensuring I had all the correct supplies, I got to work making the blanket.
All in all, I made 117 hexagons over the course of the next month, and I am sure it would have taken even longer if I had not caught COVID and was bedridden with nothing better to do then crochet like crazy during that time. It turns out; however, that making the hexagons was the fun part — sewing them all together was the real hurdle.
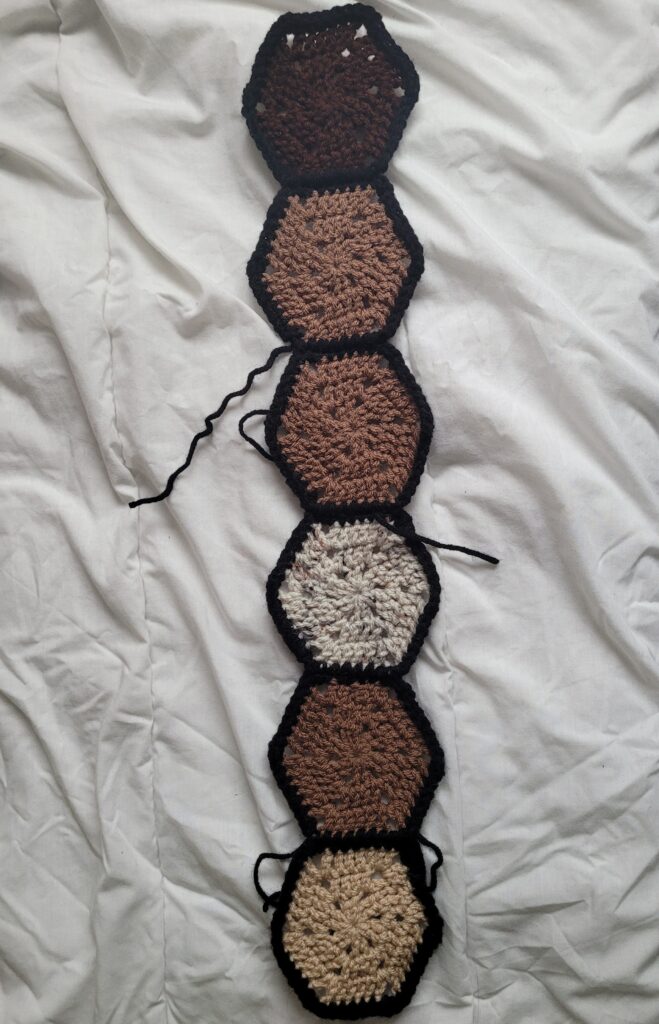
While there are several ways to join granny squares and hexagons, I ended up creating my own process after not liking how my first attempt looked. My version included crocheting a border as well as sewing each piece together, and I personally would not recommend my strategy for a larger scale project such as this. It was more tedious than the process required. If I were to do it again, I would either forgo the black border between hexagons altogether or follow this tutorial by Crafting Happiness to join them.
Wrapping up
In the end, I love how the blanket turned out and how it has started some interesting conversations.
It’s crazy to think that the same thing I use to keep warm during the winter also represents a broader message about the United States electoral system.
Want to learn more about this project? Visit the Voter Turnout Blanket page.
Interested in temperature blankets? Check out the Tempestry project to see how people are using them for climate activism.